A major live-streaming platform · Creator analytics · 2025
Creators didn't need more numbers. They needed to know whether to go live tonight.
The creator back office only reported what creators did each day. I led research and design, interviewed creators, tested prototypes with them, and over three versions turned a report card into a go-live tool.
Role
Product Designer (freelance): interview guide, running interviews, prototype tests, IA, UI
Team
PM, in-house designer (design review)
Duration
May to July 2025
700M+
Yearly visits (platform scale)
3 versions
Iterations
4 → 1
Pages merged
The brief
“Make the creator analytics usable.”
It sounded like a cleanup job. Then I opened the old back office page by page, and the problem was the order of the information. Try finding the answer below.
Friday, 7 pm. How many more streaming hours do you need this month to hit the hours bonus?
Find it in the old back office. Use the page buttons on the right.
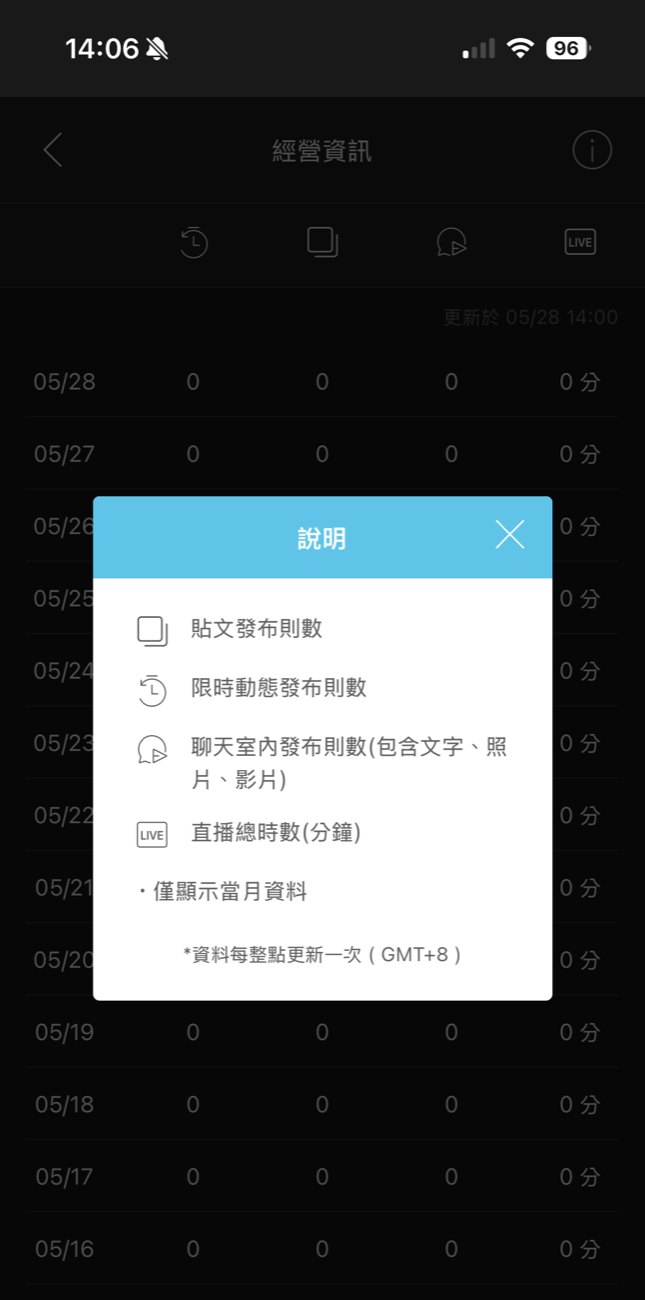
It only shows minutes streamed per day. You add up the month yourself.
Opened 1 / 4
Research
Before locking the design, I asked creators
I listed the old back office's problems and looked at two similar platforms. Then I wrote the guide and interviewed two creators, one focused on shows and one on fans. Each session started with how they decide, then moved to the prototype.
Bonus conditions come first. Have I hit the bonus? Have I hit the campaign hours?Creator B, on deciding to go live last night
Reframing
I reordered the back office around one daily decision
Every day, creators decide whether to go live tonight and for how long. That depends on how far they are from this month's goal and bonus threshold.
How I rewrote the problem
Design decisions
Three versions, each closer to how creators decide
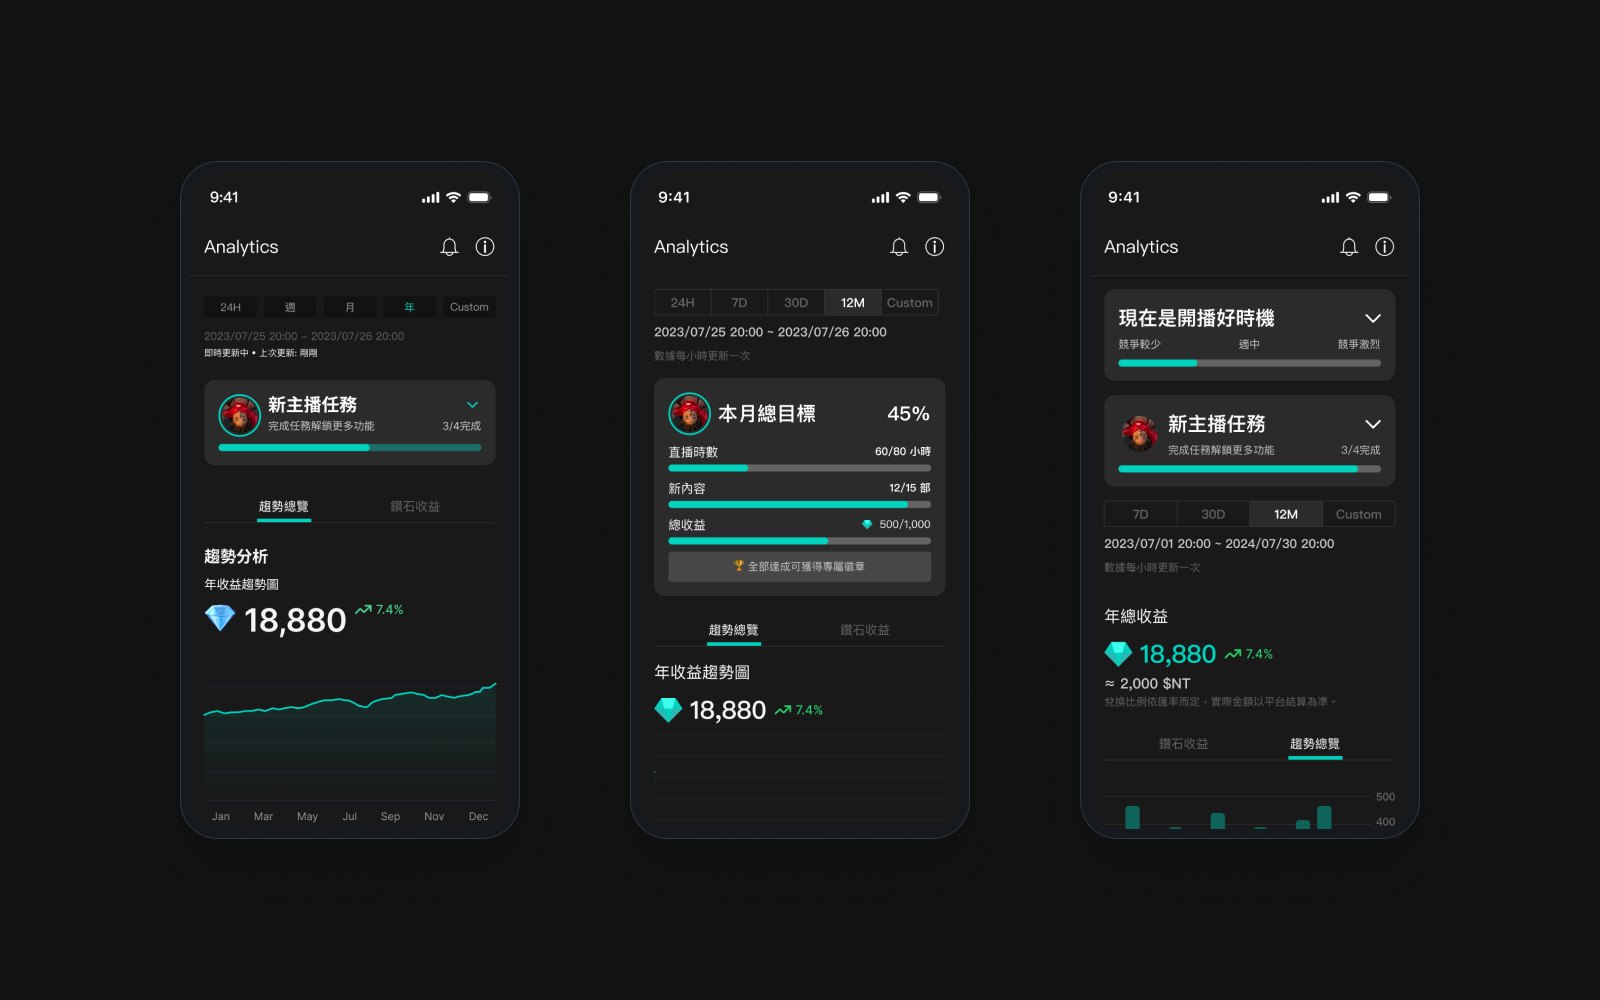
I merged four pages into one, with sections and trends.
Interviews showed creators decide by bonus thresholds and hours, so I moved this month's goal to the top and tested it.
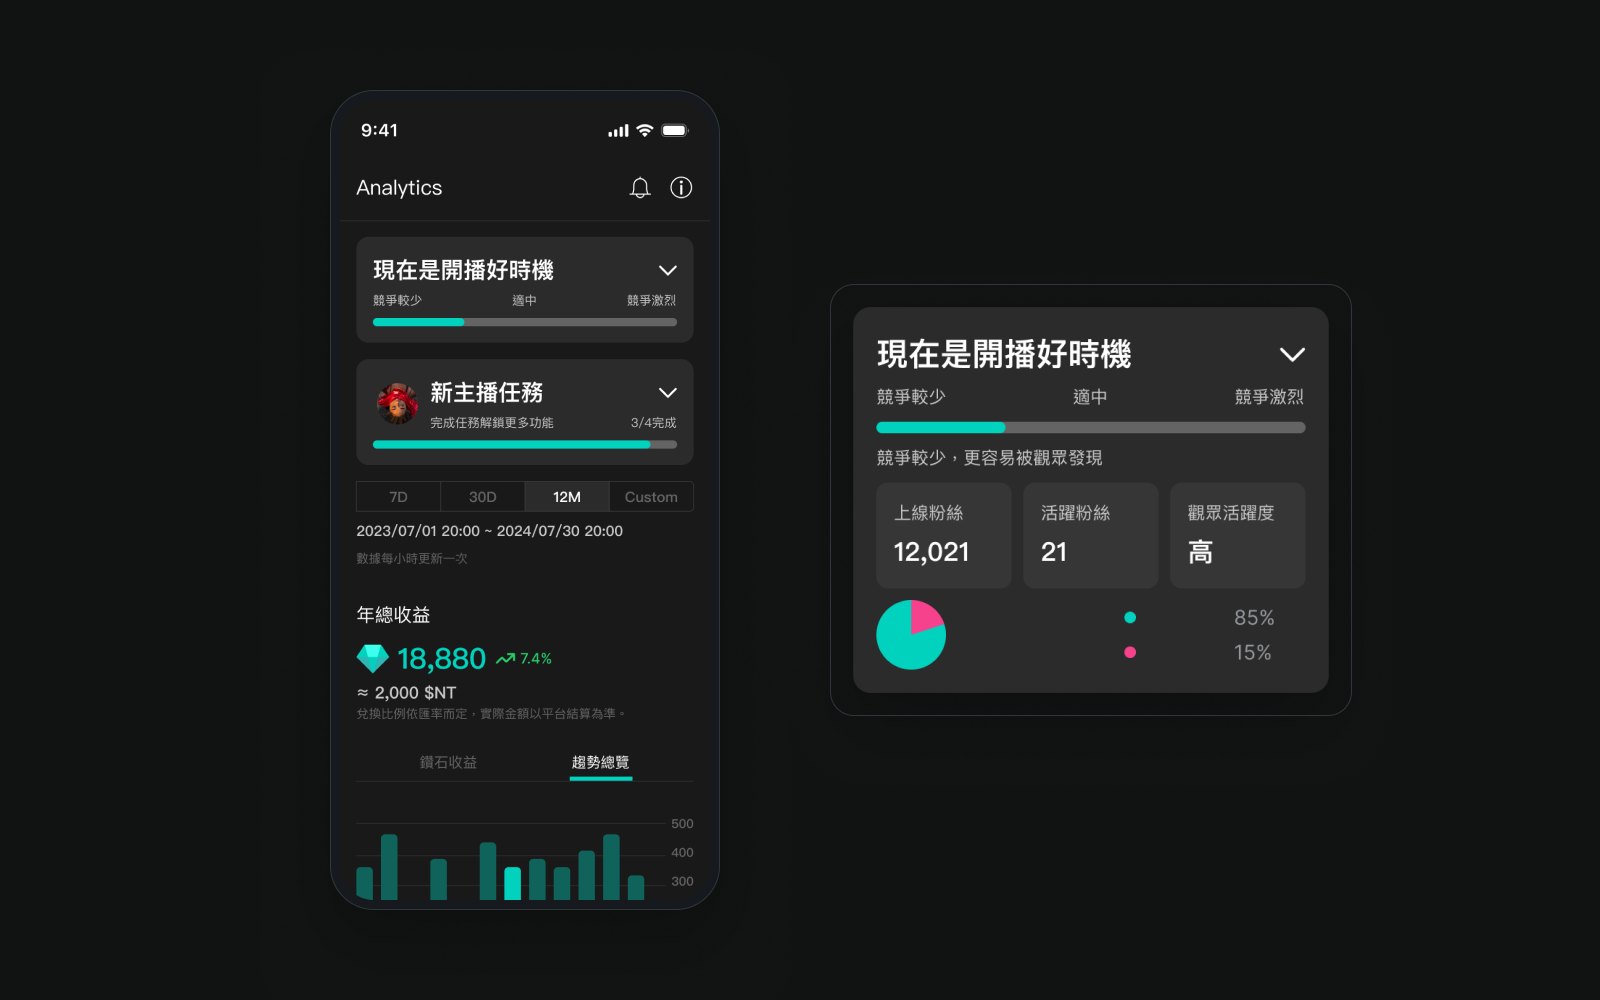
After testing, the first card says if now is a good time to go live.
Prototype testing
The goal got noticed, and questioned
It lays out exactly the earnings and goals creators care about, with trends like a stock app.Creator B, first impression after 5 seconds
How is the goal calculated?The same creator suggested covering it in onboarding, not on screen. So the operations team explains it, and the UI keeps a help link.
I'd rather set my own goalPlanned for the next version: platform goals alongside personal ones.
I can't see how many people are onlineAdded on July 3 as the first card: competition level, fans online, audience activity.
I mostly check at month endThe default range is now 30 days.
Diamond earnings matter mostDiamond earnings moved to the top.
“The dashboard is the result. The live stream itself matters more.” Creator A
Her problems were stream quality, filters and failed photo uploads in chat. A back office can't fix those, so I didn't force them in. I wrote them up as a separate list for the PM.
After launch
Three numbers I'd watch after launch
Delivered and now being built. No launch data yet; these three numbers would tell me if it works.
Has it become a daily tool?
Does checking the goal lead to a decision?
Are more creators reaching their goal?
Reflection
I nearly built a pretty, useless analytics page
My first version grouped the data well but put it in the wrong order. I sorted by data type, while creators read in the order they decide. Next time I'll ask creators to rank what they look at first, before showing any prototype, so the prototype doesn't steer their answers.